

2026 Bradford Council local elections guide
An overview of everything you need to know about the upcoming all-out elections across the district on Thursday 7 May 2026 🗳️

For the first time in years, Bradford Council will be subject to all-out elections on Thursday 7 May 2026. It’s the result of boundary changes. That basically means that all 90 council seats are being contested across the entire district for the first time since 2004.
Usually councillors are elected for four year terms in thirds (30 per election councillors) over a three year period with no elections in year four (sometimes referred to as a fallow year).
This time around, instead of just one councillor being elected for a ward, three councillors will be elected in one go. The candidate bagging first place will get to serve four years, the runner-up will serve three years and the bronze medalist will serve just one year.
You can see how the district has tended to vote on a ward-by-ward basis for Bradford Council between 2019 and 2024 here. For one councillor’s take on the boundary changes, head here.
Elections are also taking place in other local authorities throughout West Yorkshire (with all-out elections in Calderdale, Kirklees and Wakefield, too), England, Scotland and Wales.
It’ll be the biggest set of elections since the 2024 general election, which took place separately to the local elections in July that year (local elections were held, as usual, in May). Even more so in fact with news that other local elections, which had been earmarked for postponement as part of the wider reorganisation of local government that is currently underway, will now go ahead.
To get you up to speed with everything ahead of the local elections in Bradford this year we’ve put together a bumper guide. Here’s what it covers:
A timeline for the local elections in Bradford
An overview of the current composition of the council
A breakdown of the current leadership
An overview of the leaders of the other parties
A breakdown of what the council does
A list of key issues
Key stats about the district’s wards
Key documents
Timeline for the local elections in Bradford

There are some key dates to be aware ahead of the 2026 Bradford Council elections, courtesy of The Electoral Commission:
Monday 20 April: deadline for being registered to vote (if you’re not registered, you can do it here)
Tuesday 21 April up to 5pm: deadline to apply for a postal or postal-proxy vote (see here for more)
Tuesday 28 April: deadline to submit application to vote by proxy (more info here) and to apply for free voter ID (if you don’t have the required ID, you can present a voter authority certificate instead. You can apply here)
Thursday 7 May, 7am–10pm: polling day – aka the day you get to vote
Essential information
Ahead of the election you’ll receive a polling card through the post with info on where your polling station will be. Remember, you don’t need this to vote but you do need to show ID at the polling station. See here for more info on accepted forms of ID, which include a passport or a photographic version of a driving licence.
You can find out who is standing in your ward after Thursday 9 April, when a full list of candidates for Bradford Council will be published.
If you have any questions, you can contact the Electoral Services Unit at Bradford Council via email or telephone (01274 432287).
Standing as a councillor
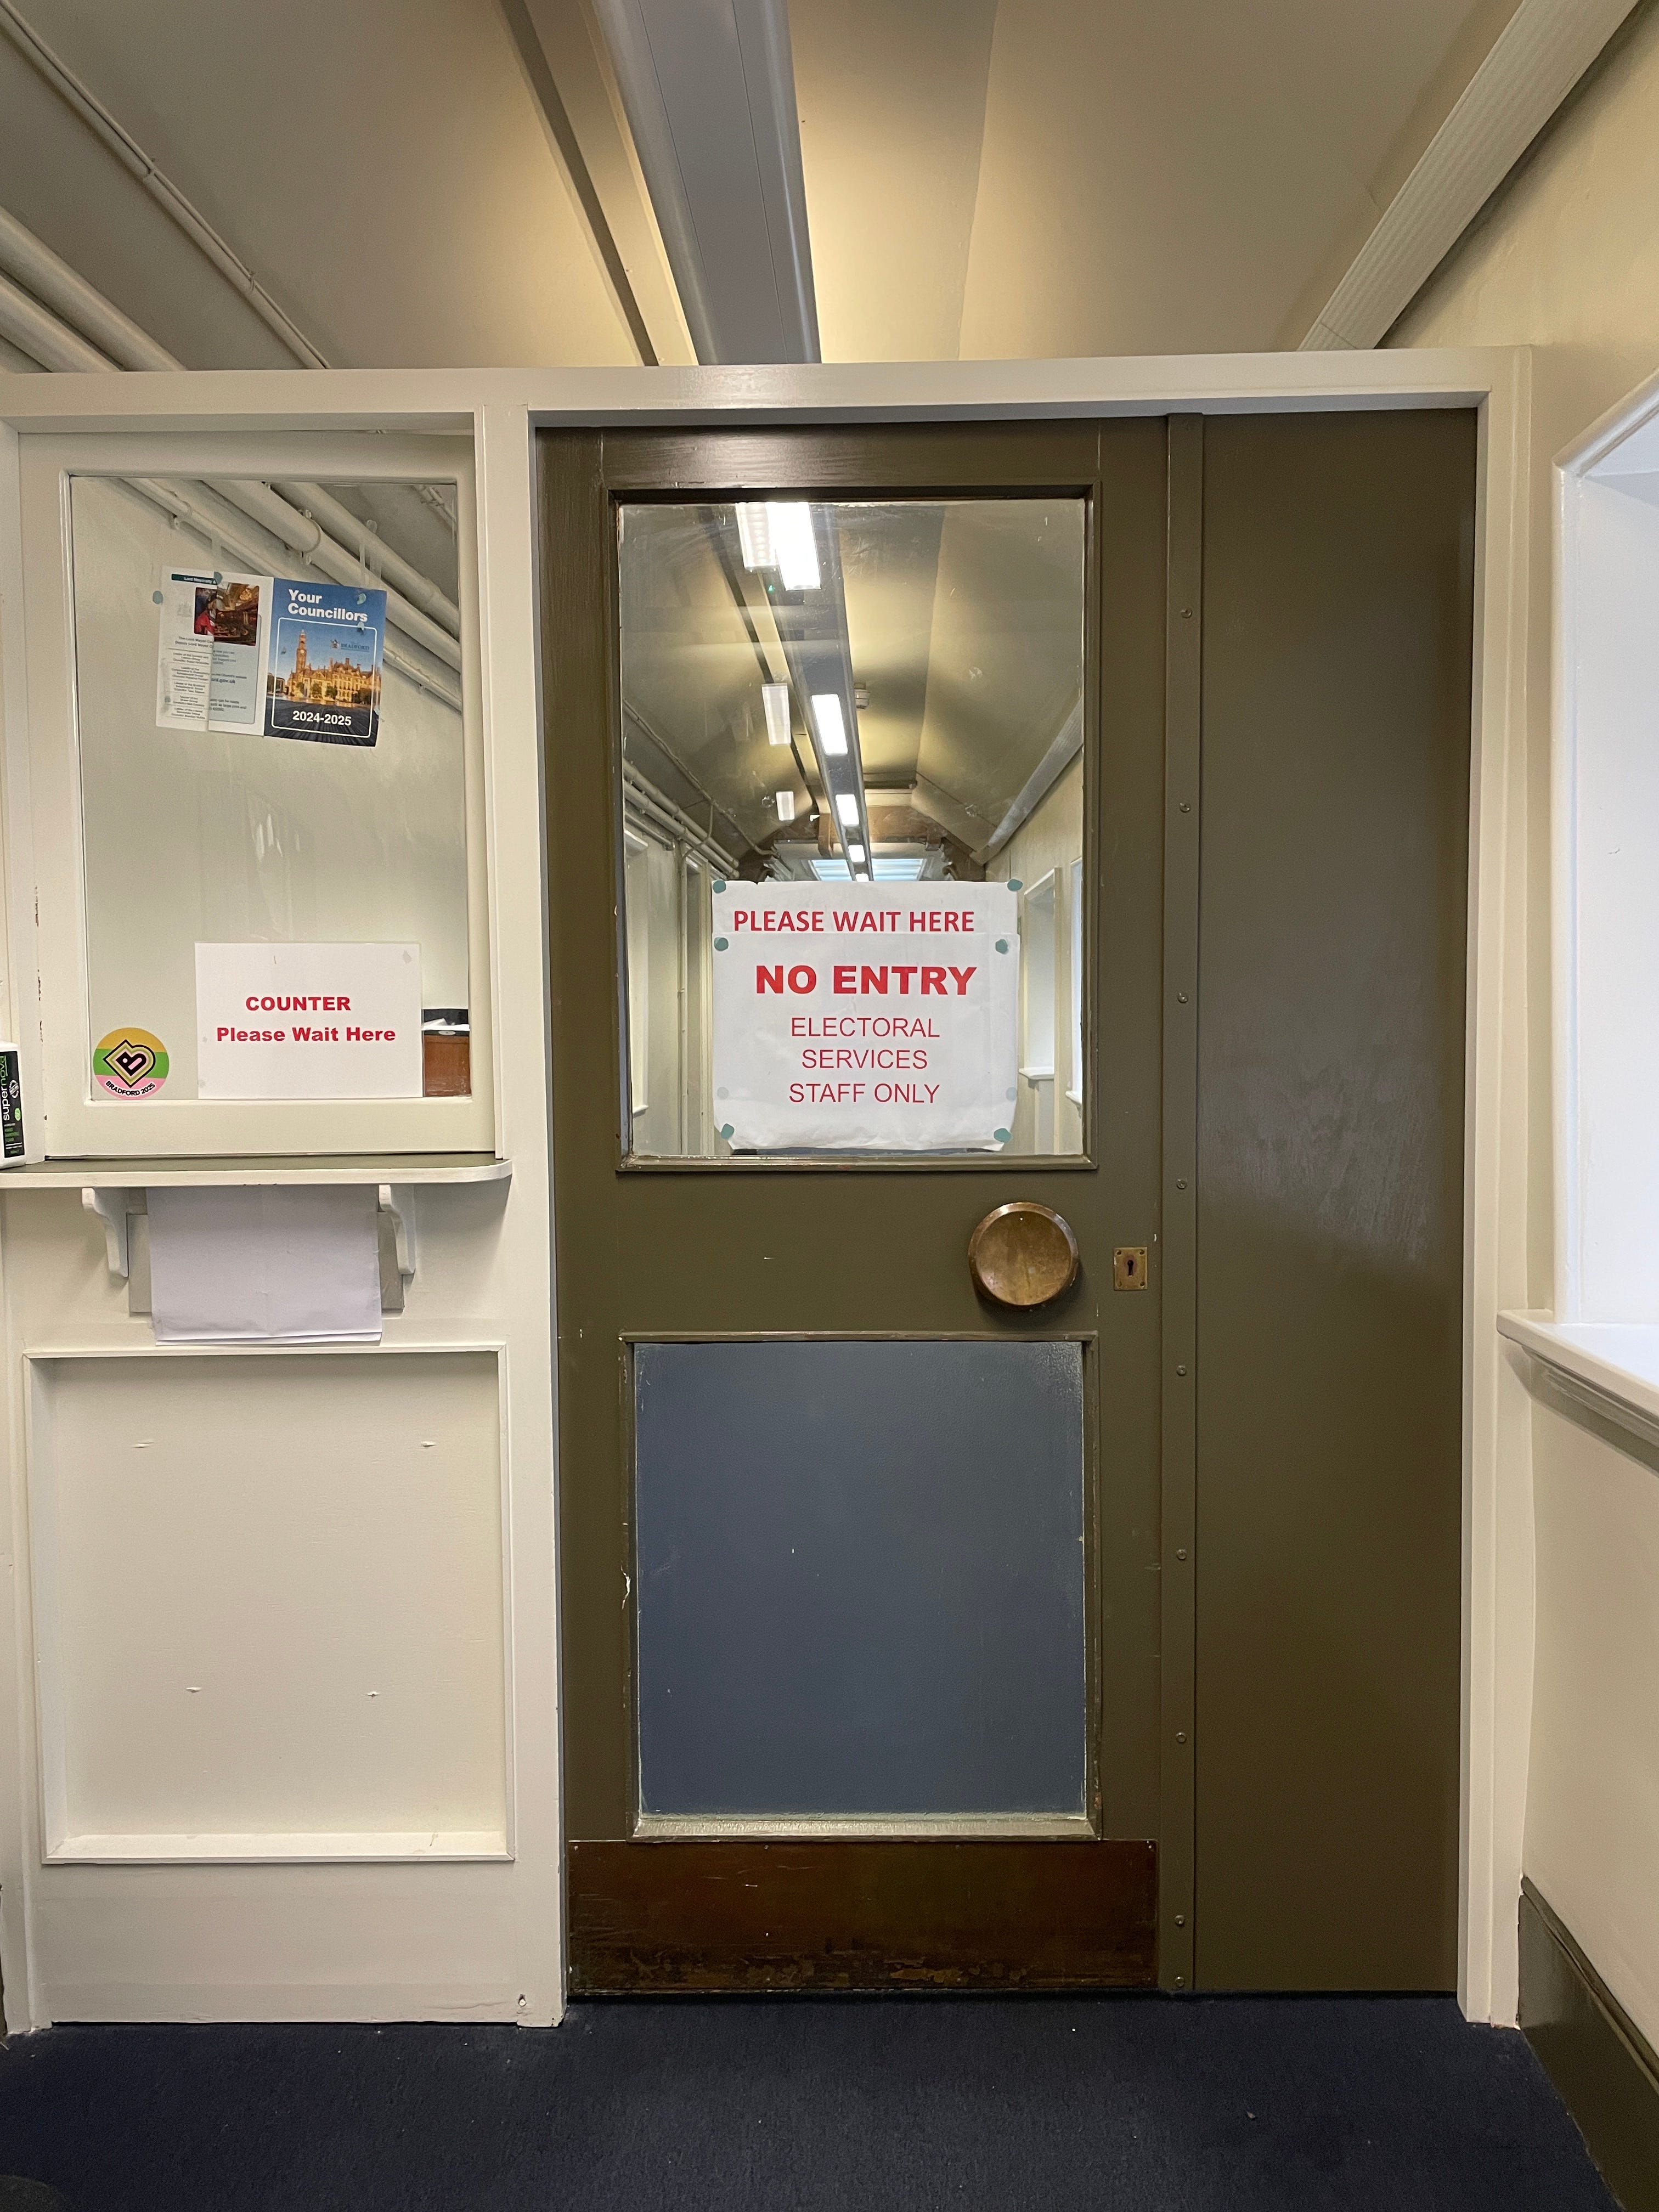
If you’re looking to stand as a candidate, either for a political party or as an independent, you have until 4pm on 9 April 2026 to submit your nomination papers in person to electoral services on the third floor of City Hall in Bradford.
All the documents needed can be acquired here, too. If you can’t get to the actual office, you should still be able to get your nomination papers sent out to you. Email electoralservices@bradford.gov.uk or call 01274 432287 to find out more.
To stand as a councillor you must, among other things:
Be at least 18
Be a British citizen
Be registered to vote or have lived or worked in the district for at least a year or be the owner or tenant of land or premises in the area
Not work for the council
Not hold a politically restricted post
Not have received a prison sentence of three months or more within the last five years
You can find out more about standing as a candidate via the Electoral Commission website here.
Bradford Council current composition
The council is made up of 90 councillors representing 30 wards that make up the Bradford District. There are three councillors per ward.
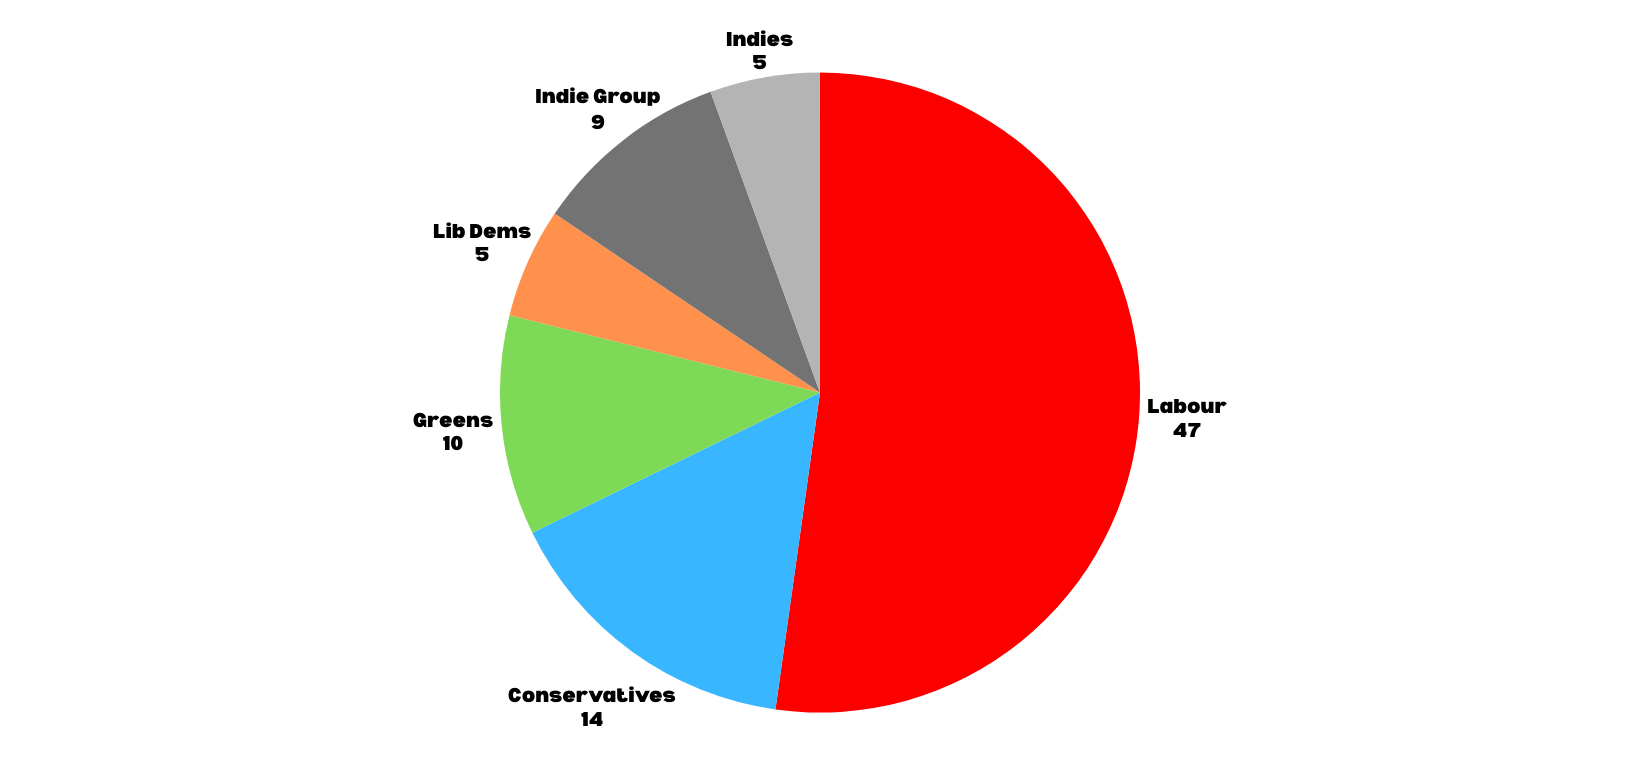
The party split on Bradford Council is:
🔴 Labour: 47
🔵 Conservative and Queensbury Independent: 14
🟢 Green Party: 10
⚪️ The Bradford Independent Group: 9
🟠 Liberal Democrat: 5
⚪️ Independents: 5
Bradford Council's current leadership

With 47 seats to its name, Labour has a majority (46 seats is the threshold). In fact, it’s had a majority since 2014 – prior to that the council had been under no overall control since the turn of the 21st century.
It’s led by …
Susan Hinchcliffe, leader of the Labour Group on Bradford Council and a councillor for the Windhill and Wrose ward. She has been in charge of the council since 2016.
She was also chair of the West Yorkshire Combined Authority between 2017 and 2021. Hinchcliffe had hoped to be the region’s first mayor, but lost out on the candidacy to Tracy Brabin who would go onto win it in 2021 (and secure a second term in 2024).
The executive
As leader of the council she’s in charge of appointing an executive that is responsible for developing and managing key portfolio areas. They include the:
Children and families portfolio led by Sue Duffy, whose remit include special educational needs and disabilities, youth justice and transport provision
Corporate portfolio led by Hinchcliffe, which covers areas like finance, human resources and the transformation programme
Education, employment and skills portfolio led by deputy leader Imran Khan, which features services like business growth and enterprise and employment and skills
Healthy people and places portfolio led by Sarah Ferriby, which looks after sports and leisure, waste and collection services, and fleet transport
Neighbourhoods and community safety portfolio led by Kamran Hussain, who oversees emergency planning, CCTV and revenues and the youth service
Regeneration, planning and transport portfolio led by Alex Ross-Shaw, whose brief includes planning,
All of the above portfolio holders are members of the Labour party, which is typical in a majority scenario at a local authority (as is the case with Bradford Council).
That means, a leader is free to appoint members to his/her executive from other parties. You’re more likely to see this in a situation where there is no overall control.
Corporate management team
All of the above are supported by Bradford Council’s corporate management team, which is managed by the chief executive Lorraine O’Donnell, who has been in post since late 2023.
She replaced Kersten England, who herself had been in the role since 2015. Her team is currently made up of the following:
Steven Mair, interim strategy director of corporate resources (he’s been at the council since February 2024)
Richard Crane, acting strategic director of children’s services
Iain MacBeath, strategic director of adult social care, health and housing
David Shepherd, strategic director of place
Euan Miller, director of the West Yorkshire Pension Fund
You can see more of the structure of the corporate management team here.
Current leadership of other parties on Bradford Council
Conservatives

Rebecca Poulson is the current leader of the Conservative and Queensbury Independent Group on Bradford Council and a councillor for Worth Valley. She has been the group’s leader since October 2020 and a councillor since at least 2011.
The deputy leader of the Conservative and Queensbury Independent Group is Debbie Davies who represents Baildon.
Green Party

Matt Edwards is the current leader of the Green Party Group and a councillor for Tong. He’s been on Bradford Council since 2021 and stood as a Green Party candidate in the 2024 general election for Bradford South, which Labour held.
The deputy leader of the Green Party Group is Ros Brown who represents Ilkley. She was first elected in 2024.
The Bradford Independent Group

Talat Sajawal is leader of the Bradford Independent Group on Bradford Council and a councillor for Little Horton. He’s been on Bradford Council since 2016 and stood as an independent candidate in the 2024 general election for Bradford East, which Labour held.
The deputy leader of the Bradford Independent Group is David Ward who represents Bolton and Undercliffe. Ward was formerly the Liberal Democrat MP for Bradford East between 2010 and 2015. He’s been a councillor since at least 2016.
Liberal Democrats

Brendan Stubbs is leader of the Liberal Democrats on Bradford Council and a councillor for Eccleshill. He’s been a councillor since at least 2016.
The deputy leader of the Liberal Democrats on Bradford Council is Riaz Ahmed who represents Bradford Moor. He’s been a councillor on and off since at least 2004.
Independents

The current independent councillors not associated with any group are Marcus Dearden (Bingley), formerly of Labour; Julie Lintern (Keighley West), also formerly of Labour; Mohammed Nazam (Keighley Central), formerly of the Conservatives; Joe Wheatley (Bingley), formerly of Labour; and Atira Malik who was elected to represent Toller in 2024 aged just 18.
Reform UK

Reform UK currently has no councillors on Bradford Council. It recently came second in a controversial by-election in Worth Valley to the Conservatives (26% versus 52%).
The result demonstrated strong support for both Conservative and right wing politics (Labour came in third place with 12% of the vote followed by the Greens with 7% and the Lib Dems with 2%), suggesting that in wards that have traditionally been loyal to the Tories are able to fend off Reform UK as we get further away from the 2024 general election.
That said, there has historically been support in the Worth Valley for more right wing parties. UKIP, for instance, had attracted votes in 2016, 2015 and 2015, while the BNP managed to get a candidate elected in 2004.
What Bradford council does
Bradford Council is responsible for delivering a wide range of services to “promote the wellbeing of their area or their inhabitants” to quote the Local Government Act 2000.
In other words, it’s responsible for looking after the area (aka the district) – think sorting out rubbish – and the people who live and work there – think adult social care.
The number of services that fall under its remit is significant – some 800 or so for councils in general, according to the Local Government Association. Most of these are statutory (i.e. required by law) and some are discretionary (i.e. there is no legal requirement to deliver them).
Some services are delivered inhouse, some are delivered via third parties. They include:
Art and culture
Council tax collection
Education
Elections
Emergency planning
Environmental protection
Highways
Housing
Leisure and recreation
Libraries
Licensing
Parking
Planning
Roads
Street cleaning
Social care
Tax collection (council tax and business rates)
Tourism
Transport
Waste collection and disposal
You can discover the services offered by Bradford Council here.
What services cost the most to manage
According to Bradford Council’s statement of accounts for 2024/25, most of its budget went on children’s services, followed by adult social care, department of place (which covers areas like highways, planning, waste management, neighbourhoods, parks and leisure), central budget and corporate resources.
More and more of the council’s budget, as with local authorities more generally, is being spent on children and adult social care, which averages somewhere in the region of 60%.
In fact Bradford Council noted in January 2024 that “projected spend on adult and children’s services this 2025/26 [was] equivalent to 87% of the budget agreed for 23/24”. That ultimately means there is a smaller pot of cash to fund the delivery of other statutory services.
How Bradford Council is funded
Typically the council gets its revenue from three main sources: central government grants, council tax and business rates (it also generates cash via fees and charges).
Lately an additional source has been added into the mix – exceptional financial support. This has been made available to local authorities like Bradford Council who have requested “financial assistance to handle pressures that they considered unmanageable”.
For 2024/25, the funding breakdown was therefore as follows:
council tax (45%)
capitalisation direction (22%), which allows the council to “borrow money, sell assets and to manage its debt over the longer term” (exceptional)
central government grants (22%)
business rates (11%)
Significant cuts in central government grants that were made between 2010 and 2020 (40.1% in real terms according to the Institute for Government) have been blamed for the serious financial strain being experienced by councils like Bradford, which has long been one of the most deprived local authorities in the country.
Others believe that the financial pressures faced by the council, as a result of austerity, has also been exacerbated by poor and costly decisions made by the current executive.
The Labour government’s Final Local Government Financial Settlement is aiming, in part, to address some of the financial challenges faced by councils with what it describes as a “fairer funding system”.
Approximately £78 billion is being allocated to local authorities throughout England via a “new evidence-based approach that properly recognises local need and the true costs of providing services in deprived areas”, the ministry of housing, communities and local government explained recently.
Bradford District: key issues
Here’s a list of some of the specific and ongoing challenges facing the district, which, like many other councils, is dealing with significant and ongoing financial pressures and growing demand for key services like adult and social care:
Low living standards
Deep-rooted deprivation
Poor health outcomes
Increasing child poverty
Significant inequalities
High unemployment
Lower than average qualification levels
Low skill economy
Low-wage economy
Low prevalence of new economy firms
Poor quality housing
Poor transport connectivity
Bradford District wards: key stats
The district is home to 30 wards, which range in population size and demographics, from Ilkley having the highest percentage of old people in its boundaries (defined as 64–84) to Manningham being the most deprived (the index ranks 1 as most deprived and 30 as the least deprived).
Here are some key stats sourced directly from Bradford Council, correct up to April 2024:
Baildon

Councillors: 3 Conservatives
Population: 16,230
Employment:
retail and wholesale trade (14.5%)
human health and social work activities (14.1%)
education (12.4%)
Deprivation:
ranked 27 out of 30 in the district
ranked 26 for income deprivation
ranked 25 for employment deprivation
ranked 28 for education, skills and training deprivation (EST)
Housing:
7,223 households
41.7% live in semi-detached houses or bungalows
28.1% live in detached houses or bungalows
14.8% live in terraced houses
10.8% live in flats
77% live in owner-occupied housing
13.3% rent from a private landlord
9.6% rent from a social landlord
Religion:
51.7% Christian
40.7% no religion
Ethnicity
95.1% White
1.7% Multiple/mixed ethnic groups
0.9% Pakistani
Bingley

Councillors: 2 independent, 1 Labour
Population: 18,250
Employment:
human health and social work activities (14.6%)
retail and wholesale trade (13.4%)
education (13.2%)
Deprivation:
ranked 25 out of 30 in the district
ranked 24 for income deprivation
ranked 24 for employment deprivation
ranked 23 for EST deprivation
Housing:
8,277 households
27.8% live in terraced housing
22.7% live in detached housing
27.4% live in semi-detached housing or bungalows
16.6% live in flats
77% live in owner-occupied housing
13.3% rent from a private landlord
9.6% rent from a social landlord
Religion:
49.6% Christian
41.7% no religion
Ethnicity:
94.2% White
1.8% Multiple/mixed ethnic groups
1.6% Pakistani
Bingley Rural

Councillors: 3 Conservatives
Population:
19,030
Employment:
human health and social work activities (15.3%)
retail and wholesale trade (15%)
education (12.6%)
Deprivation:
ranked 26 out of 30 in the district
ranked 25 for income deprivation
ranked 25 for employment deprivation
ranked 24 for EST for deprivation
Housing:
8,277 households
38.4% live in semi-detached houses or bungalows
29.1% live terraced housing
24.9% live in detached housing
5.3% live in flats
75.7% live in owner-occupied housing
15% rent from a private landlord
9.3% rent from a social landlord
Religion:
48.1% Christian
39.9% no religion
Ethnicity:
90.5% White
4.3% Pakistani
2.3% Multiple/mixed ethnic groups
1% Indian
Bolton and Undercliffe

Councillors: 2 Labour, 1 independent
Population: 17,860
Employment:
retail and wholesale trade (20.3%)
human health and social work activities (14.3%)
education (10.3%)
Deprivation:
ranked 15 out of 30 in the district
ranked 18 for income deprivation
ranked 19 for employment deprivation
ranked 15 for EST deprivation
Housing:
54.6% live in semidetached houses or bungalows
25.2% live in terraced housing
9.8% live in detached housing
7.9% live in flats
64.8% live in owner-occupied housing
25.1% rent from a private landlord
10.1% rent from a social landlord
Religion:
34.3% Muslim
29.3% Christian
24.8% no religion
Ethnicity:
53.0% White
25.7% Pakistani
6.2% Bangladeshi
4.9% Indian
Bowling and Barkerend

Councillors: 2 Labour, 1 independent
Population: 23,490
Employment:
retail and wholesale trade (22.2%)
human health and social work activities (13.7%)
manufacturing (9.7%)
Deprivation:
ranked 3 out of 30 in the district
ranked 4 for income deprivation
ranked 4 for employment deprivation
ranked 5 for EST deprivation
Housing:
7,714 households
48.3% live in terraced housing
22.3% live in semi-detached houses or bungalows
19.4% live in flats
5.8% live in detached houses
42.3% live in owner-occupied housing
33.1% rent from a private landlord
24.5% rent from a social landlord
Religion:
53.4% Muslim
21.5% Christian
16.4% no religion
2% Sikh
Ethnicity:
39.9% Pakistani
35.0% White
8.1% Bangladeshi
3.6% Multiple/mixed ethnic groups
3.5% Indian
Bradford Moor

Councillors: 2 Labour, 1 Lib Dem
Population: 21,880
Employment:
retail and wholesale trade (22.8%)
human health and social work activities (12.3%)
transport and storage (11.2%)
Deprivation:
ranked 4 out of 30 in the district
ranked 3 for income deprivation
ranked 6 place for employment deprivation
ranked 3 for EST deprivation
Housing:
5,900 households
59.5% live in terraced housing
25.4% live in semi-detached houses or bungalows
8.2% live in flats
4.9% live in detached houses
55.4% live in owner-occupied housing
26.9% rent from a private landlord
17.5% rent from a social landlord
Religion:
77.6% Muslim
8.6% Christian
5.9% religion not stated
5.3% no religion
Ethnicity:
66.4% Pakistani
12.6% White
6.2% Bangladeshi
3.6% Indian
City

Councillors: 2 Labour, 1 independent
Population: 23,640
Employment:
retail and wholesale trade (21.2%)
human health and social work activities (12.4%)
manufacturing (9.4%)
Deprivation:
ranked 7 out of 30 in the district
ranked 9 for income deprivation
ranked 12 for for employment deprivation
ranked 12 for EST for deprivation
Housing:
8,215 households
37.8% live in terraced housing
35.7% live in flats
7.2% live in a shared household (including bedsits)
6.9% live in a converted building
6.8% of the households live in semidetached houses or bungalows
2.7% live in detached houses
54.3% rent from a private landlord
28% live in owner-occupied housing
17.3% rent from a social landlord
Religion:
59.9% Muslim
18% Christian
10.8% no religion
6.4% religion not stated
3.7% Hindu
Ethnicity:
46% Pakistani
21.6% White
8.2% Indian
7.9% Black
Clayton and Fairweather Green

Councillors: 3 Labour
Population: 18,320
Employment:
retail and wholesale trade (19.5%)
human health and social work activities (17.1%)
education (10.3%)
Deprivation:
ranked 16 out of 30 in the district
ranked 14 for income deprivation
ranked 13 for employment deprivation
ranked 14 for EST deprivation
Housing:
6,637 households
48.6% live in semi-detached houses or bungalows
25.5% live in terraced housing
13.7% live in detached houses
10.5% live in flats
62.7% live in owner-occupied housing
21.9%rent from a private landlord
15.4% rent from a social landlord
Religion:
34.1% Muslim
31.8% Christian
5.6% religion not stated
2.7% Hindu
1.9% Sikh
Ethnicity:
53.2% White
29.3% Pakistani
6.3% Indian
3.2% Multiple/mixed ethnic groups
Craven

Councillors: 3 Greens
Population: 17,930
Employment:
human health and social work activities (18.9%)
retail and wholesale trade (14%)
education (10.2%)
Deprivation:
ranked 28 out of 30 for deprivation
ranked 28 for income deprivation
ranked 28 for employment deprivation
ranked 27 for EST deprivation
Housing:
8,124 households in Craven
33.1% live in terraced housing
31.5% live in semi-detached houses or bungalows
25.5% of households live in detached houses
5.3% live in flats
77.2% live in owner-occupied housing
16.9% rent from a private landlord
5.9% rent from a social landlord
Religion:
52.6% Christian
39.9% no religion
5.5% religion not stated
0.9% Muslim
Ethnicity:
96.1% White
1.1% Indian
1.1% Multiple/mixed ethnic groups
Eccleshill

Councillors: 2 Labour, 1 Lib Dem
Population: 20,640
Employment:
retail and wholesale trade (20.5%)
human health and social work activities (16.2%)
manufacturing (10.4%)
Deprivation:
ranked 10 out of 30 in the district
ranked 10 for income deprivation
ranked 11 place for employment deprivation
ranked 8 for EST deprivation
Housing:
8,088 households
59.1% live in semi-detached houses or bungalows
22.4% live in terraced housing
10.4% live in flats
6.5% live in detached houses or bungalows
56.3% live in owner-occupied housing
20.8% rent from a private landlord
22.8% rent from a social landlord
Religion:
39.8% no religion
36.3% Christian
16.8% Muslim
Ethnicity:
75.5% White
13.9% Pakistani
3.8% Multiple/mixed ethnic groups
1.5% Bangladeshi
Great Horton

Councillors: 2 Labour, 1 independent
Population: 19,110
Employment:
retail and wholesale trade (20.3%)
human health and social work activities (15.3%)
education (10.3%)
Deprivation:
ranked 9 out of 30 in the district
ranked 7 for income deprivation
ranked 8 for employment deprivation
ranked 9 for EST deprivation
Housing:
6,287 households
42.2% live in terraced housing
40.5% live in semi-detached houses or bungalows
8.8% live in detached houses or bungalows
6.9% live in flats
58.2% live in owner-occupied housing
28.9% rent from a private landlord
12.8% rent from a social landlord
Religion:
57.7% Muslim
20.7% Christian
11.4% no religion
3% Hindu
Ethnicity:
48.8% Pakistani
29.8% White
7.3% Indian
4.4% other ethnic group
Heaton

Councillors: 2 Labour, 1 independent
Population: 19,950
Employment:
retail and wholesale trade (18.1%)
human health and social work activities (16.9%)
education (12.5%)
Deprivation:
ranked 12 out of 30 in the district
ranked 12 for income deprivation
ranked 13 for employment deprivation
ranked 16 for EST deprivation
Housing:
5,720 households
50.5% live in semi-detached houses or bungalows
22.2% live in terraced housing
16.9% live in detached houses or bungalows
7.9% live in flats
63.4% live in owner-occupied housing
23.7% rent from a private landlord
12.7% rent from a social landlord
Religion:
69.8% Muslim
14.6% Christian
8.5% no religion
5.4% religion not stated
Ethnicity:
62.7% Pakistani
21.7% White
3.6% other Asian
2.9% Indian
Idle and Thackley

Councillors: 3 Lib Dems
Population: 17,620
Employment:
retail and wholesale trade (14.5%)
human health and social work activities (14.5%)
education (11.6%)
Deprivation:
ranked 23 out of 30 in the district
ranked 22 for income deprivation
ranked 23 for employment deprivation
ranked 22nd for EST deprivation
Housing:
7,717 households
33.7% live in semidetached houses or bungalows
24.3% live in detached houses or bungalows
23.2% live in terraced housing
15.7% live in flats
71.7% live in owner-occupied housing
15.8% rent from a private landlord
12.4% rent from a social landlord
Religion:
47.9% Christian
41.4% no religion
5.5% religion not stated
2.3% Muslim
1.6% Sikh
Ethnicity:
91.2% White
3.0% Multiple/mixed ethnic groups
2% Indian
1.3% Pakistani
Ilkley

Councillors: 2 Conservative, 1 Green
Population: 15,200
Employment:
human health and social work activities (14.1%)
education (13.3%)
retail and wholesale trade (12.7%)
Deprivation:
ranked 29 of 30 wards in the district
ranked 29 for income deprivation
ranked 29 for employment
ranked for EST deprivation
Housing:
6,736 households
27.2% live in detached houses or bungalows
23.3% live in terraced housing
22.9% live in semidetached houses or bungalows
17.3% live in flats
8.1% live in a converted building
78.2% live in owner-occupied housing
14.7% rent from a private landlord
7.1 rent from a social landlord
Religion:
53% Christian
39.4% no religion
5.5% religion not stated
0.9% Muslim
Ethnicity:
95.6% White
2.0% Multiple/mixed ethnic groups
0.6% Pakistani
0.5% Indian
Keighley Central

Councillors: 2 Labour, 1 independent
Population: 18,740
Employment:
retail and wholesale trade (19.5%)
human health and social work activities (17.3%)
manufacturing (11.7%)
Deprivation:
ranked 6 out of 30 in the district
ranked 8 for income deprivation
ranked 4 for employment deprivation
ranked 6 for EST deprivation
Housing:
6,223 households
47.6% live in terraced housing
18% live in semi-detached houses or bungalows
15.2% live in flats
12.8% live in detached houses or bungalows
56% live in owner-occupied housing
30.6% rent from a private landlord
13.1% rent from a social landlord
Religion:
57.3% Muslim
21% Christian
15.5% no religion
5.3% religion not stated
Ethnicity:
48% Pakistani
36.3% White
7.6% Bangladeshi
3% other Asian
Keighley East

Councillors: 3 Labour
Population: 17,220
Employment:
retail and wholesale trade (17%)
human health and social work activities (16%)
manufacturing (10.9%)
Deprivation:
ranked 20 out of 30 wards in the district
ranked 20 for income deprivation
ranked 20 for employment deprivation
ranked 20 for EST deprivation
Housing:
7,008 households
40.3% live in semi-detached houses or bungalows
34.7% live in terraced housing
17% of households live in detached houses or bungalows
6.1% live in flats
71.7% live in owner-occupied housing
20% rent from a private landlord
8.3% rent from a social landlord
Religion:
39% Christian
35.3% no religion
18.8% Muslim
5.6% religion not stated
Ethnicity:
76.2% White
16% Pakistani
2.5% Bangladeshi
2.1% Multiple/mixed ethnic groups
Keighley West

Councillors: 2 Labour, 1 independent
Population: 17,270
Employment:
human health and social work activities (17.6%)
retail and wholesale trade (17.4%)
manufacturing (13.2%)
Deprivation:
ranked 6 out of 30 in the district
ranked 8 for income deprivation
ranked 4 for employment deprivation
ranked 6 for EST deprivation
Housing:
7,333 households in Keighley West
46.6% live in semi-detached houses or bungalows
33.6% live in terraced housing
10.8% live in detached houses or bungalows
6.5% live in flats
Religion:
42.6% no religion
42.5% Christian
8.7% Muslim
5.2% religion not stated
Ethnicity:
87.4% White
6.2% Pakistani
2.4% Multiple/mixed ethnic groups
1.7% Bangladeshi
Little Horton

Councillors: 3 independents
Population: 22,000
Employment:
retail and wholesale trade (22.6%)
human health and social work activities (13.9%)
manufacturing (10.4%)
Deprivation:
ranked 2 out of 30 in the district
ranked 2 for income deprivation
ranked 2 for employment deprivation
ranked 1 for EST deprivation
Housing:
6,594 households in Little Horton
55.3% live in terraced housing
28.2% live in semi-detached houses or bungalows
9.4% live in flats
5.4% live in detached houses or bungalows
45% live in owner-occupied housing
29.1% rent from a private landlord
25.7% rent from a social landlord
Religion:
65.7% Muslim
18.7% Christian
8.6% no religion
5% religion not states
Ethnicity:
55.4% Pakistani
22.4% White
5.1% Black
3.3% Multiple/mixed ethnic groups
Manningham

Councillors: 2 Labour, 1 independent
Population: 21,180
Employment:
wholesale and retail trade (21.5%)
human health and social work activities (14.6%)
education (9.4%)
Deprivation:
ranked 1 out of 30 in the district (the most deprived ward)
ranked 1 for income deprivation
ranked 1 for employment deprivation
ranked 1 for EST deprivation
Housing:
5,650 households
53.7% live in terraced housing
24.2% live in flats
10.4% live in semi-detached houses or bungalows
5.7% live in part of a converted building
4% live in detached houses or bungalows
44% live in owner-occupied housing
29.3% of households rent from a private landlord
26.5% rent from a social landlord
Religion:
77.4% Muslim
10.6% Christian
10.6% not stated
4.6% no religion
Ethnicity:
62.7% Pakistani
11.9% White
9.7% Bangladeshi
4.4% Indian
Queensbury

Councillors: 2 Labour, 1 independent
Population: 17,640
Employment:
retail and wholesale trade (16.6%)
human health and social work activities(15%)
education (10.6%)
Deprivation:
ranked 22 out of 30 in the district
ranked 23 for income deprivation
ranked 22 for employment deprivation
ranked 21 for EST deprivation
Housing:
7,323 households
37.8% live in semi-detached houses or bungalows
32.7% live in terraced housing
23% live in detached houses or bungalows
4.2% live in flats
Religion:
43.1% Christian
41.7% no religion
7.0% Muslim
5.0% religion not stated
1.9% Hindu
Ethnicity:
85.8% White
6.0% Pakistani
3.2% Indian
2.5% Multiple/mixed ethnic groups
Royds

Councillors: 3 Labour
Population: 18,200
Employment:
retail and wholesale trade (18.4%)
human health and social work activities(16%)
manufacturing (9.4%)
Deprivation:
ranked 11 out of 30 in the district
ranked 11 for income deprivation
ranked 10 for employment deprivation
ranked 11 place for EST deprivation
Housing:
7,327 households
57.6% live in semi-detached houses or bungalows
22.7% live in terraced housing
10.3% live in detached houses or bungalows
8.2% live in flats.
59.9% of Royds households live in owner-occupied housing
20.9% of households rent from a private landlord
19.1% rent from a social landlord
Religion:
41.9% no religion
40.1% Christian
10.4% Muslim
5.6% religion not stated
Ethnicity:
81.1% White
8.9% Pakistani
3.7% Multiple/mixed ethnic groups
2.2% Black
1.9% Indian
Shipley

Councillors: 3 Greens
Population: 15,710
Employment:
human health and social work activities (17.7%)
education (14.9%)
wholesale and retail trades (13.1%)
Deprivation:
ranked 21 out of 30 in the district
ranked 21 for income deprivation
ranked 21 for employment deprivation
ranked 26 for EST deprivation
Housing:
7,182 households
35% live in terraced housing
28.1% live in semi-detached houses or bungalows
18.1% live in flats
8.8% live in a converted building
8.2% live in detached houses or bungalows
Religion:
40.8% no religion
36.7% Christian
14.8% Muslim
5.6% religion not stated
Ethnicity:
78.2% White
12.3% Pakistani
3.1% Multiple/mixed ethnic groups
1.6% Indian
Thornton and Allerton

Councillors: 3 Labour
Population: 18,560
Employment:
human health and social work activities (18.4%)
wholesale and retail trades (17.3%)
education (11.2%)
Deprivation:
ranked 18 out of 30 in the district
ranked 16 for income deprivation
ranked 16 for employment deprivation
ranked 19 for EST deprivation
Housing:
7,416 households
45.7% live in semidetached houses or bungalows
26.5% live in terraced housing
17.1% live in detached houses or bungalows
8.6% live in flats
63.9% live in owner-occupied housing
19.7% rent from a private landlord
16.3% rent from a social landlord
Religion:
37.7% Christian
29.8% no religion
25.0% Muslim
5.4% religion not stated
Ethnicity:
65.3% White
21.8% Pakistani
4.1% Multiple/mixed ethnic groups
2.2% Indian
Toller

Councillors: 2 Labour, 1 independent
Population: 20,900
Employment:
wholesale and retail trades (21.1%)
human health and social work activities (16.1%)
education (10.9%)
Deprivation:
ranked 5 out of 30 wards in the district
ranked 6 for income deprivation
ranked 7 for employment deprivation
ranked 7 place for EST deprivation
Housing:
5,648 households
49.1% live in terraced housing
23.4% live in semi-detached houses or bungalows
11.1% live in flats
10.7% live in detached houses or bungalows
4.7% live in converted buildings
59.3% live in owner-occupied housing
31.6% rent from a private landlord
8.9% rent from a social landlord
Religion:
80.1% Muslim
8.9% Christian
5.2% religion not stated
4.2% no religion
Ethnicity:
75.3% Pakistani
10.6% White
3.2% other ethnic group
3.1% Indian
2.8% other Asian
Tong

Councillors: 3 Greens
Population: 21,270
Employment:
wholesale and retail trades (21.2%)
human health and social work activities (15%)
manufacturing (13.2%)
Deprivation:
ranked 8 out of 30 in the district
ranked 5 for income deprivation
ranked 3 for employment deprivation
ranked 4 for EST deprivation
Housing:
8,616 households
45.8% live in semi-detached houses or bungalows
25% live in terraced housing
13.6% live in detached houses or bungalows
13.4% live in flats
44% live in owner-occupied housing
34.7% rent from a social landlord
21.1% rent from a private landlord
Religion:
41.2% no religion
41.1% Christian
8.9% Muslim
5.9% religion not stated1.6% Sikh
Ethnicity:
78.5% White
6.9% Pakistani
4.4% Black
4.3% Multiple/mixed ethnic groups
2.4% Indian
Wharfedale

Councillors: 2 Conservative, 1 Labour
Population: 12,170
Employment:
human health and social work activities (14.6%)
education (13.7%)
professional, scientific and technical activities (11.9%)
Deprivation:
ranked 30 out of 30 for deprivation (least deprived)
ranked 30 for income deprivation
ranked 30 for employment deprivation
ranked 30 for EST deprivation
Housing:
5,128 households
36.9% live in detached houses or bungalows
29.8% live in semi-detached houses or bungalows
21% live in terraced housing
9.1% live in flats
83.2% live in owner-occupied housing
10.3% of households rent from a private landlord
6.5% rent from a social landlord
Religion:
53.2% Christian
39.8% no religion
5.1% religion not stated
Ethnicity:
96.5% White
1.4% Multiple/mixed ethnic groups
0.6% Indian
Wibsey

Councillors: 3 Labour
Population: 16,090
Employment:
wholesale and retail trades (17.7%)
human health and social work activities (15.4%)
education (9.9%)
Deprivation:
ranked 13 out of 30 in the district
ranked 14 for income deprivation
ranked 17 for employment deprivation
ranked 18 for EST deprivation
Housing:
6,348 households
46.4% live in semi-detached houses or bungalows
38.7% live in terraced housing
6.7% live in flats and
6.7% live in detached houses or bungalows
65% live in owner-occupied housing
24% rent from a private landlord
10.8% rent from a social landlord.
Religion:
36.5% Christian
28.5% Muslim
28% no religion
5% religion not stated
Ethnicity:
62.7% White
24.9% Pakistani
3.6% Multiple/mixed ethnic groups
2.2% Black
2.2% Indian
Windhill and Wrose

Councillors: 3 Labour
Population: 17,080
Employment:
wholesale and retail trades (17.1%)
human health and social work activities (15.4%)
manufacturing (10.7%)
Deprivation:
ranked 17 out of 30 in the district
ranked 17 for income deprivation
ranked 15 for employment deprivation
ranked 13 EST deprivation
Housing:
7,388 households
53% live in semidetached houses or bungalows
20.2% live in terraced housing
15.1% live in flats
9% live in detached houses or bungalows
61.6% live in owner-occupied housing
18.9% rent from a private landlord
19.2% rent from a social landlord
Religion:
43.6% no religion
39.8% Christian
8.3% Muslim
2.1% Sikh
Ethnicity:
83.5% White
6.1% Pakistani
3.0% Multiple/mixed ethnic groups
2.3% Indian
1.3% Black
Worth Valley

Councillors: 3 Conservatives
Population: 14,260
Employment:
human health and social work activities (14.6%)
wholesale and retail trades (13.5%)
education (11.9%)
Deprivation:
ranked 24 out of 30 in the district
ranked 27 for income deprivation
ranked 25 for employment deprivation
ranked 25 for EST deprivation
Housing:
6,422 households
43.9% live in terraced housing
27.1% live in semi-detached houses or bungalows
20.3% live in detached houses or bungalows
3.7% live in flats
77.1% live in owner-occupied housing
19.2% rent from a private landlord
3.7% rent from a social landlord
Religion:
48.6% Christian
44.7% no religion
5.1% religion not stated
0.7% other religion
Ethnicity:
97.3% White
1.4% Multiple/mixed ethnic groups
0.4% Pakistani
0.3% Black
Wyke

Councillors: 3 Labour
Population: 15,230
Employment:
wholesale and retail trades (17.7%)
human health and social work activities (13.2%)
manufacturing (10.4%)
Deprivation:
ranked 19 out of 30 in the district
ranked 18 for income deprivation
ranked 18 for employment deprivation
ranked 17 EST deprivation.
Housing:
6,617 households
50.6% live in semi-detached houses or bungalows
30.7% live in terraced housing
11.8%live in detached houses or bungalows
5.2% live in flats
68.3% live in owner-occupied housing
19.2% rent from a private landlord
12.5% rent from a social landlord
Religion:
48.6% Christian
44.7% no religion
5.1% religion not stated
Ethnicity:
97.3% White
1.4% Multiple/mixed ethnic groups
0.4% Pakistani
0.3% Black
For more detail on each of the wards, head to the ward profiles page on Bradford Council’s website.
Key documents
Below you’ll find a list of documents that have been produced by both the council – inhouse, via the Bradford District Partnership and with other authorities – and independently in recent years. Some are dated.
Built Different: Bradford 2025–2035 (regeneration and growth plan)
Local Government Outcomes Framework (Ministry of Housing, Communities and Local Government)
A place to call home, a place to thrive: housing strategy for the district 2020–2030
Stronger Communities Together: strategy for Bradford District 2018–2023
What a fantastic piece! So valuable and helpful for all voters. Thank you